Project information
- Category: DataViz
- Client: CASA0003: Group Mini Project: Digital Visualisation
- Project date: 26 May, 2023
- Project URL: here
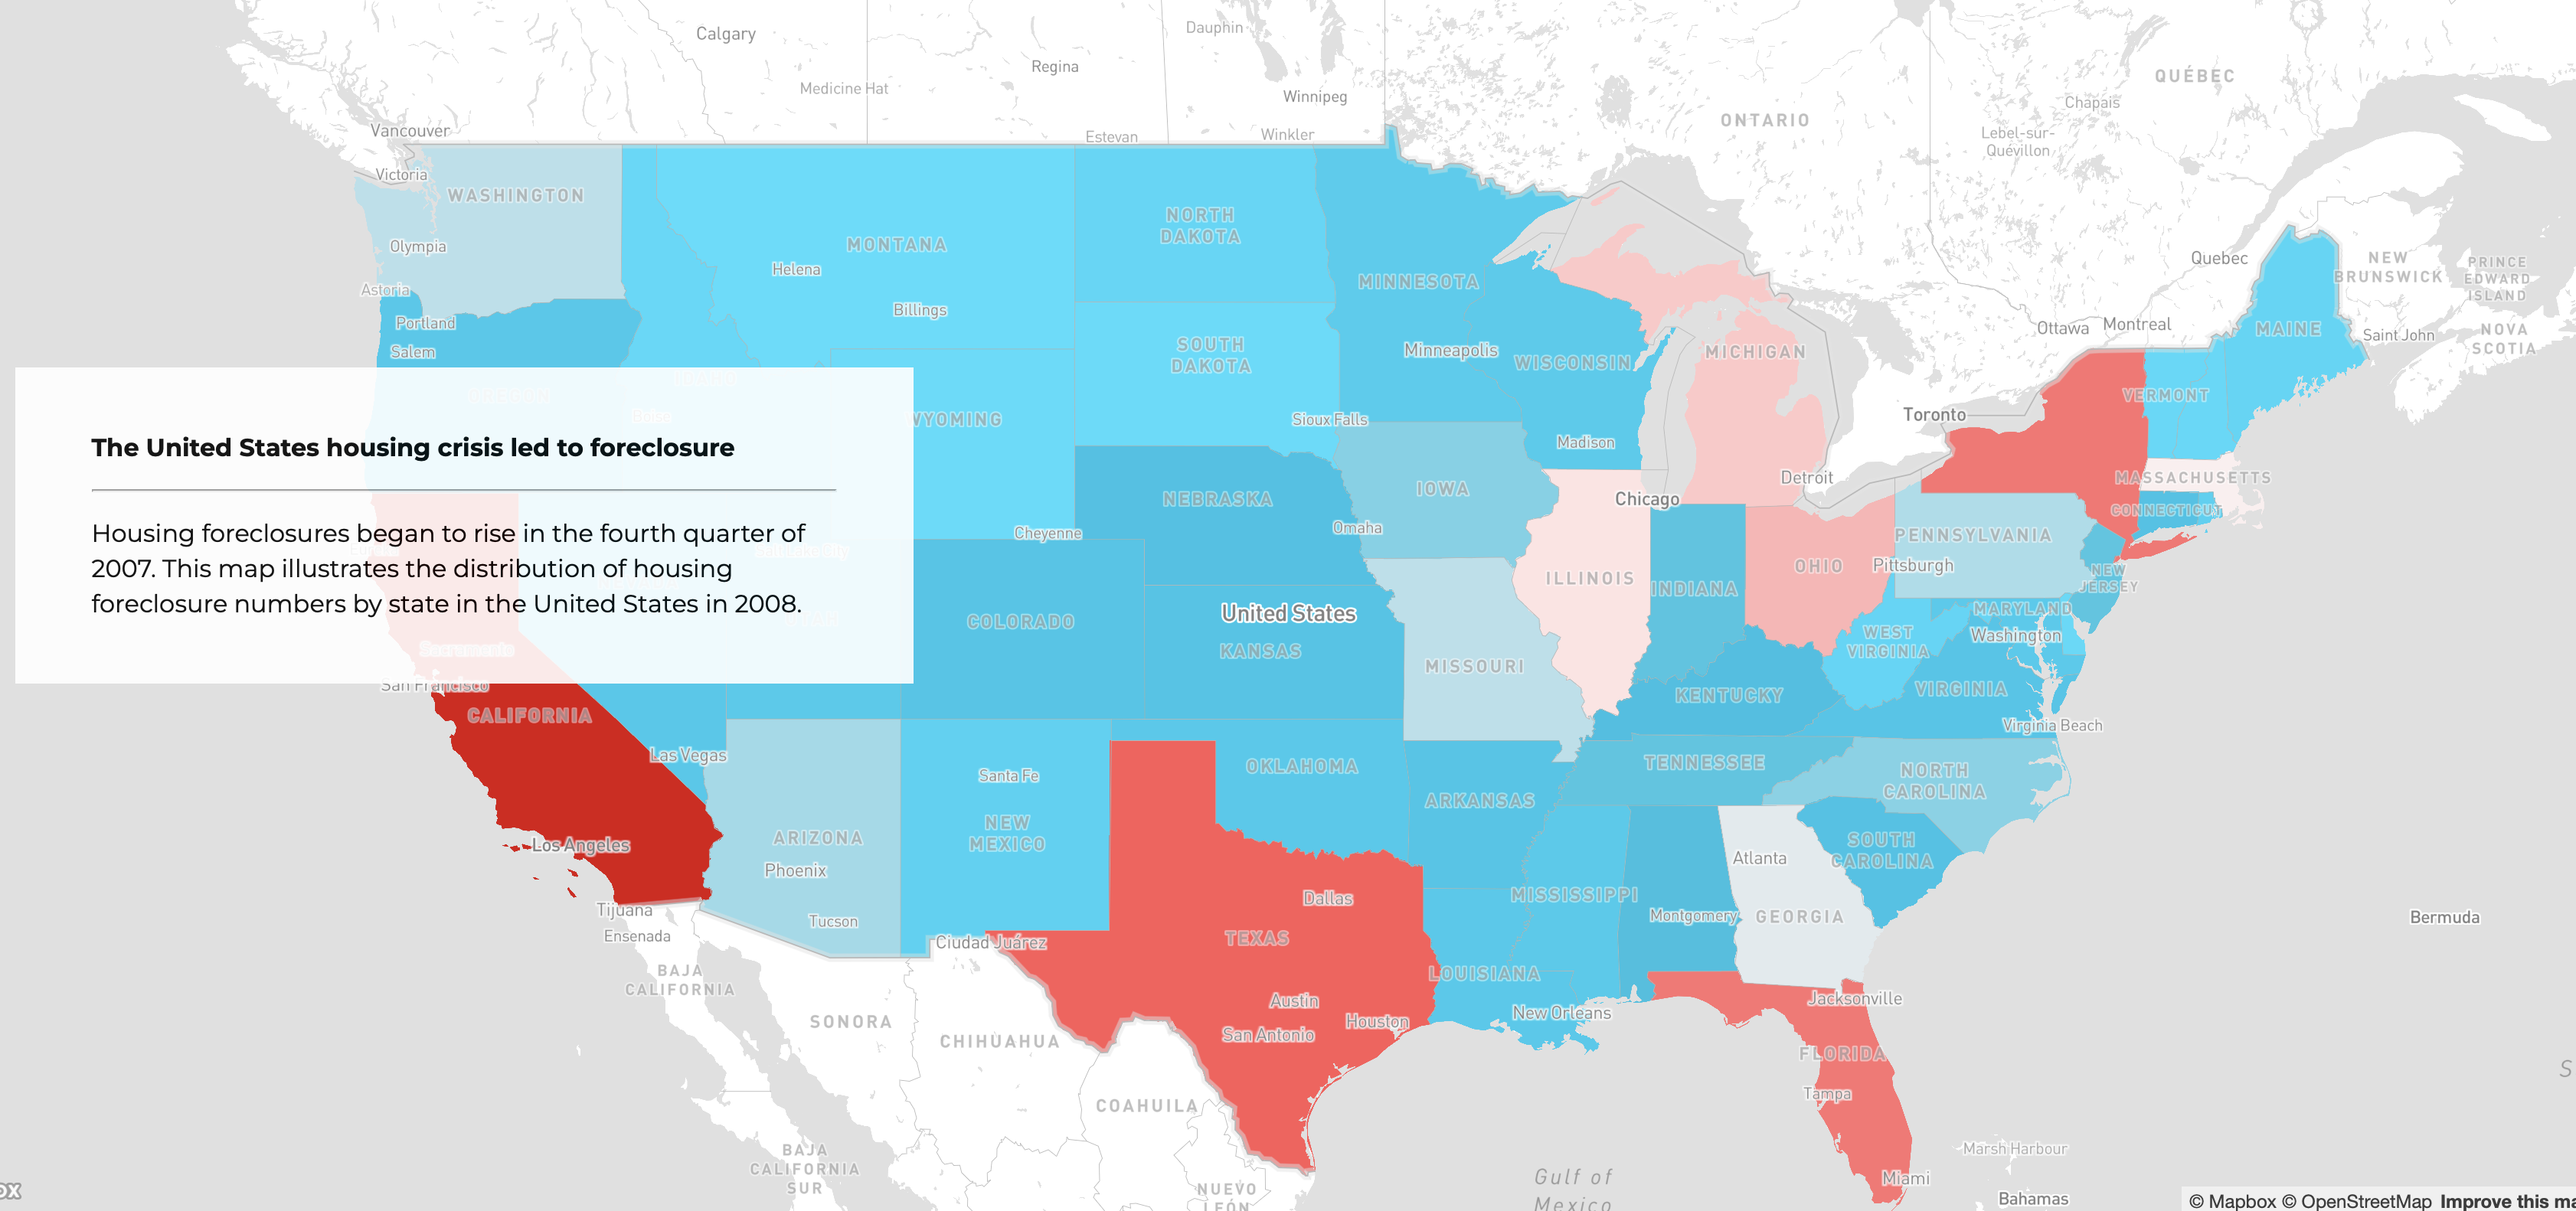
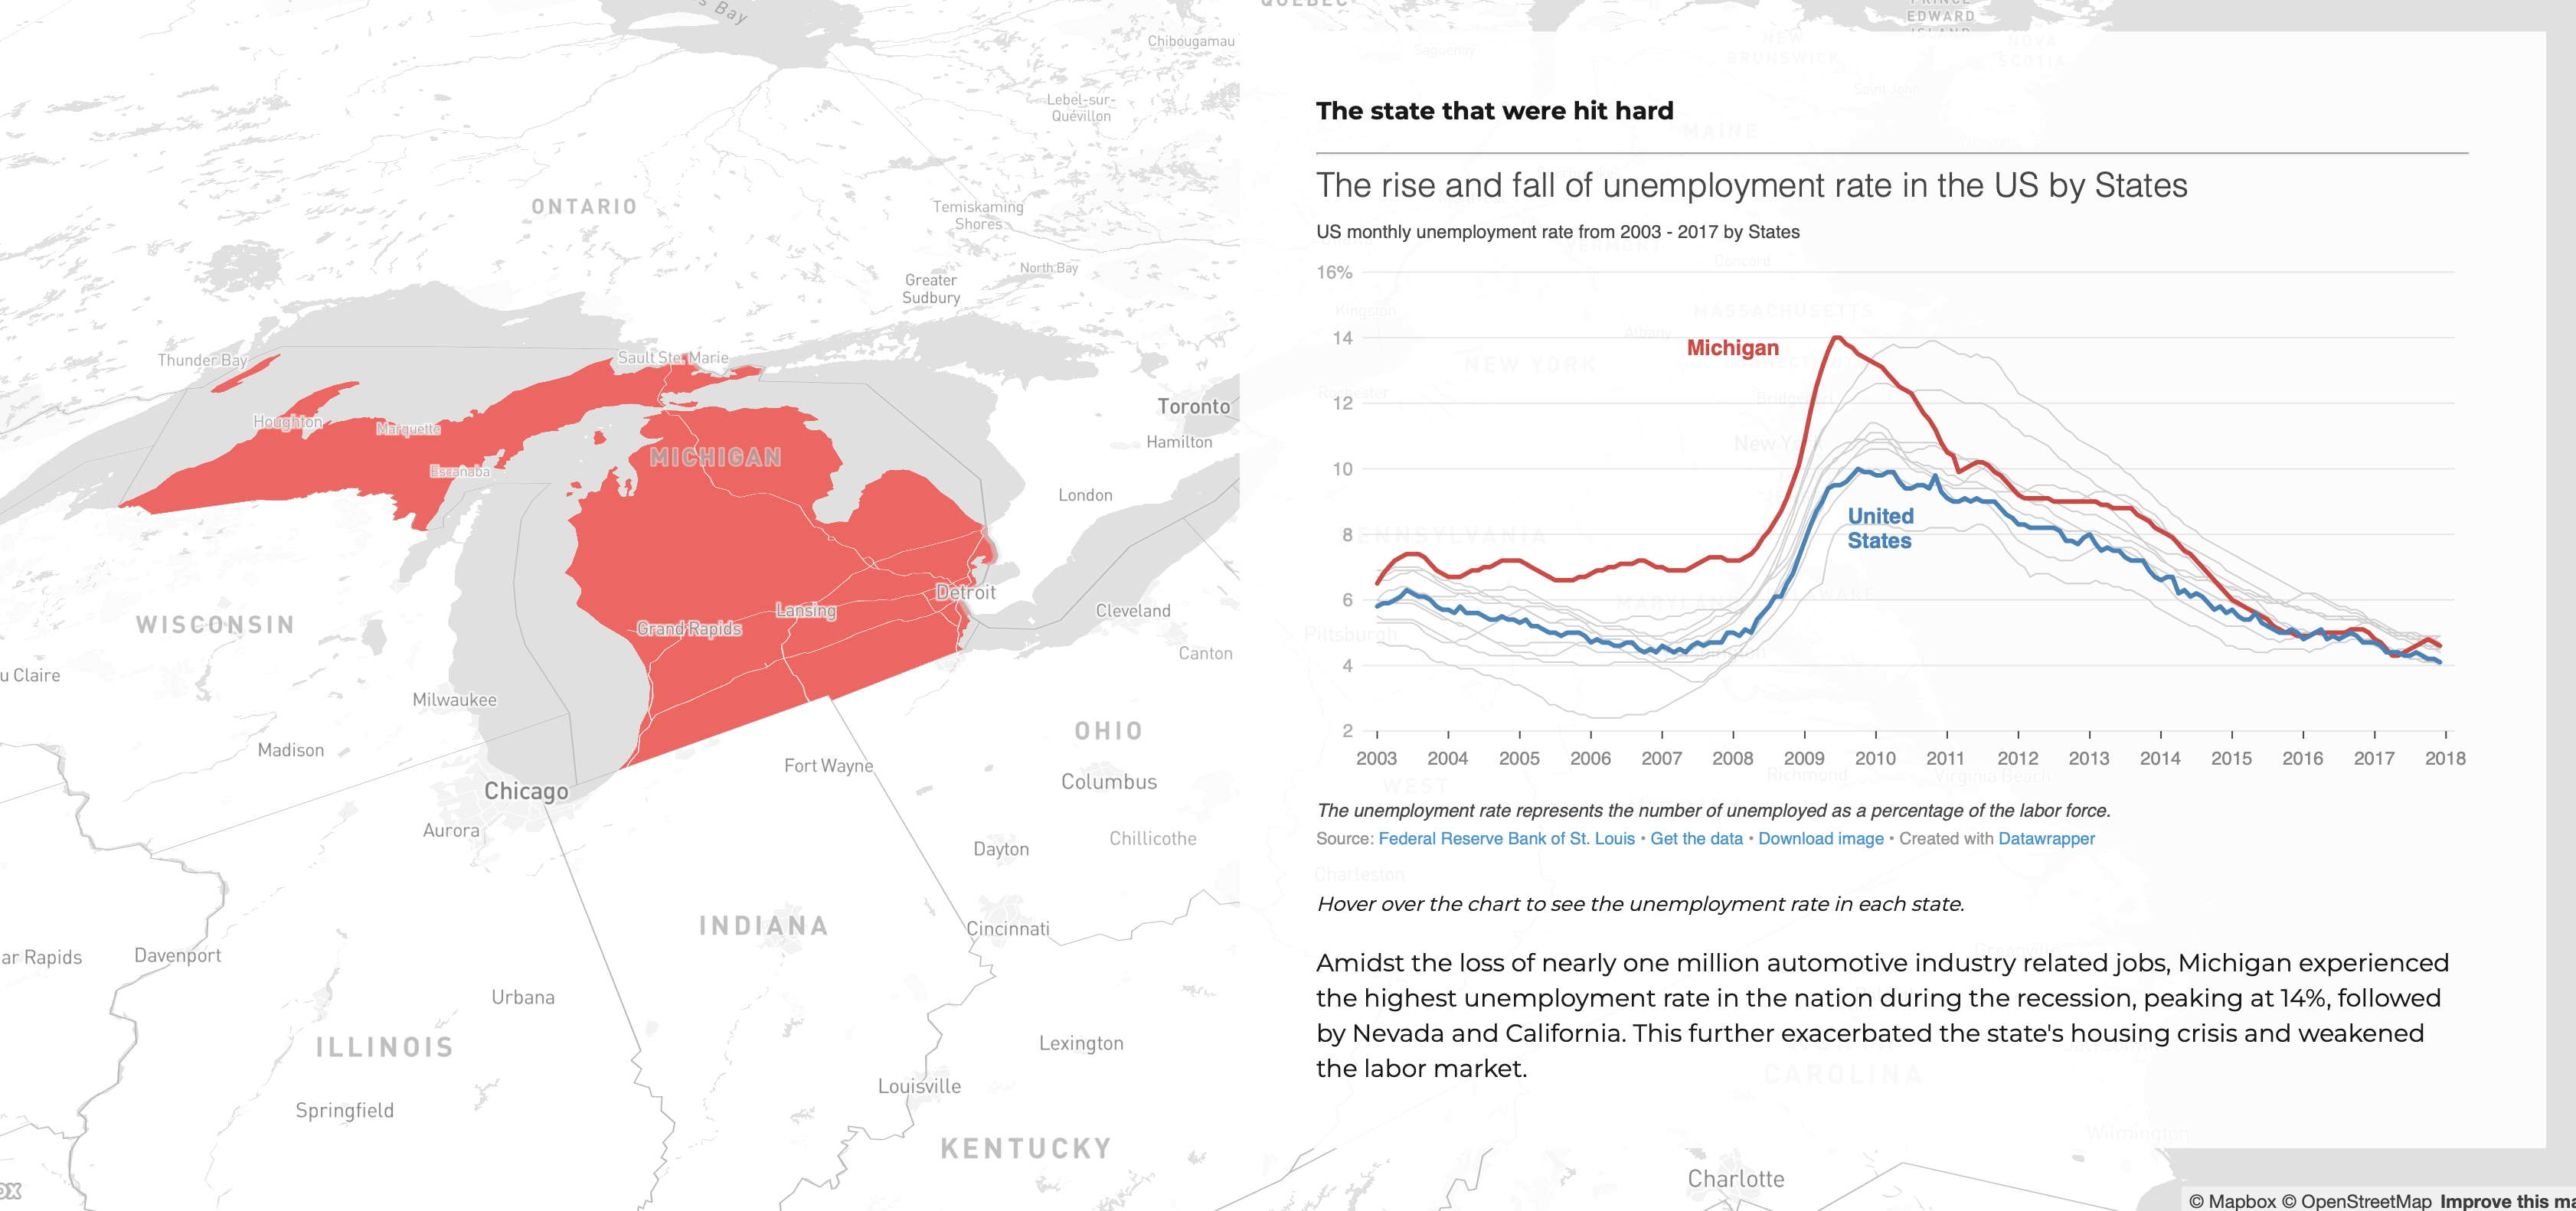
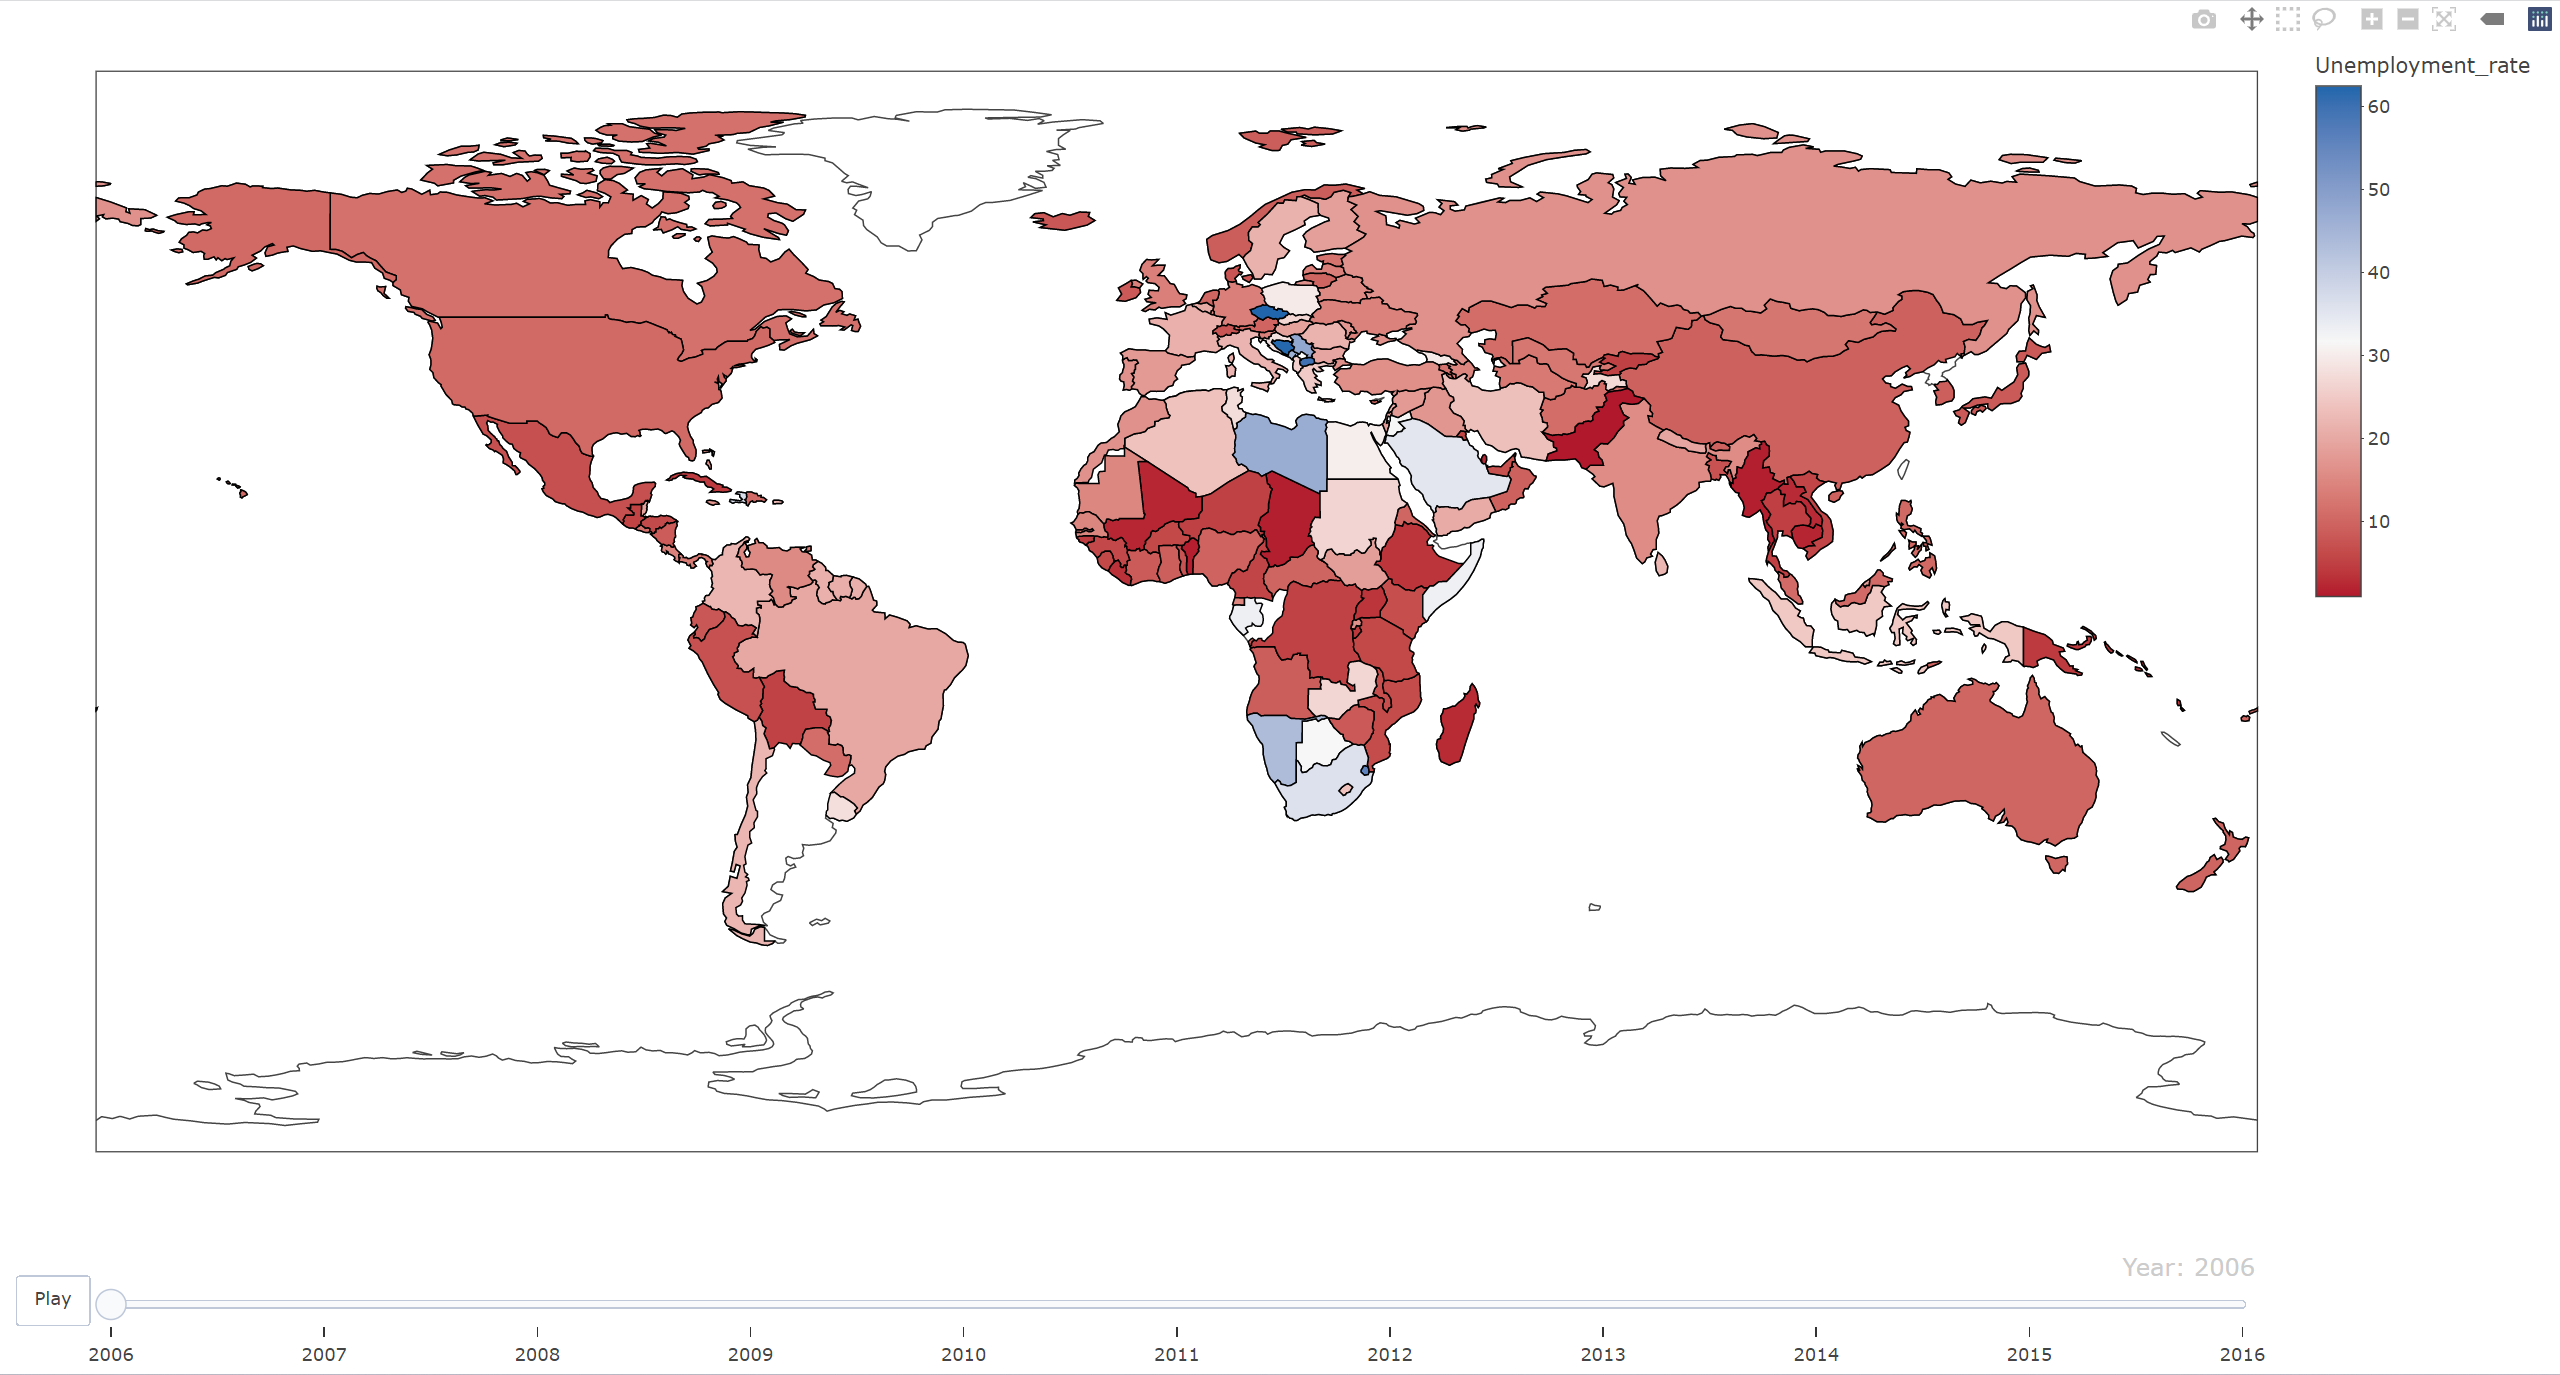
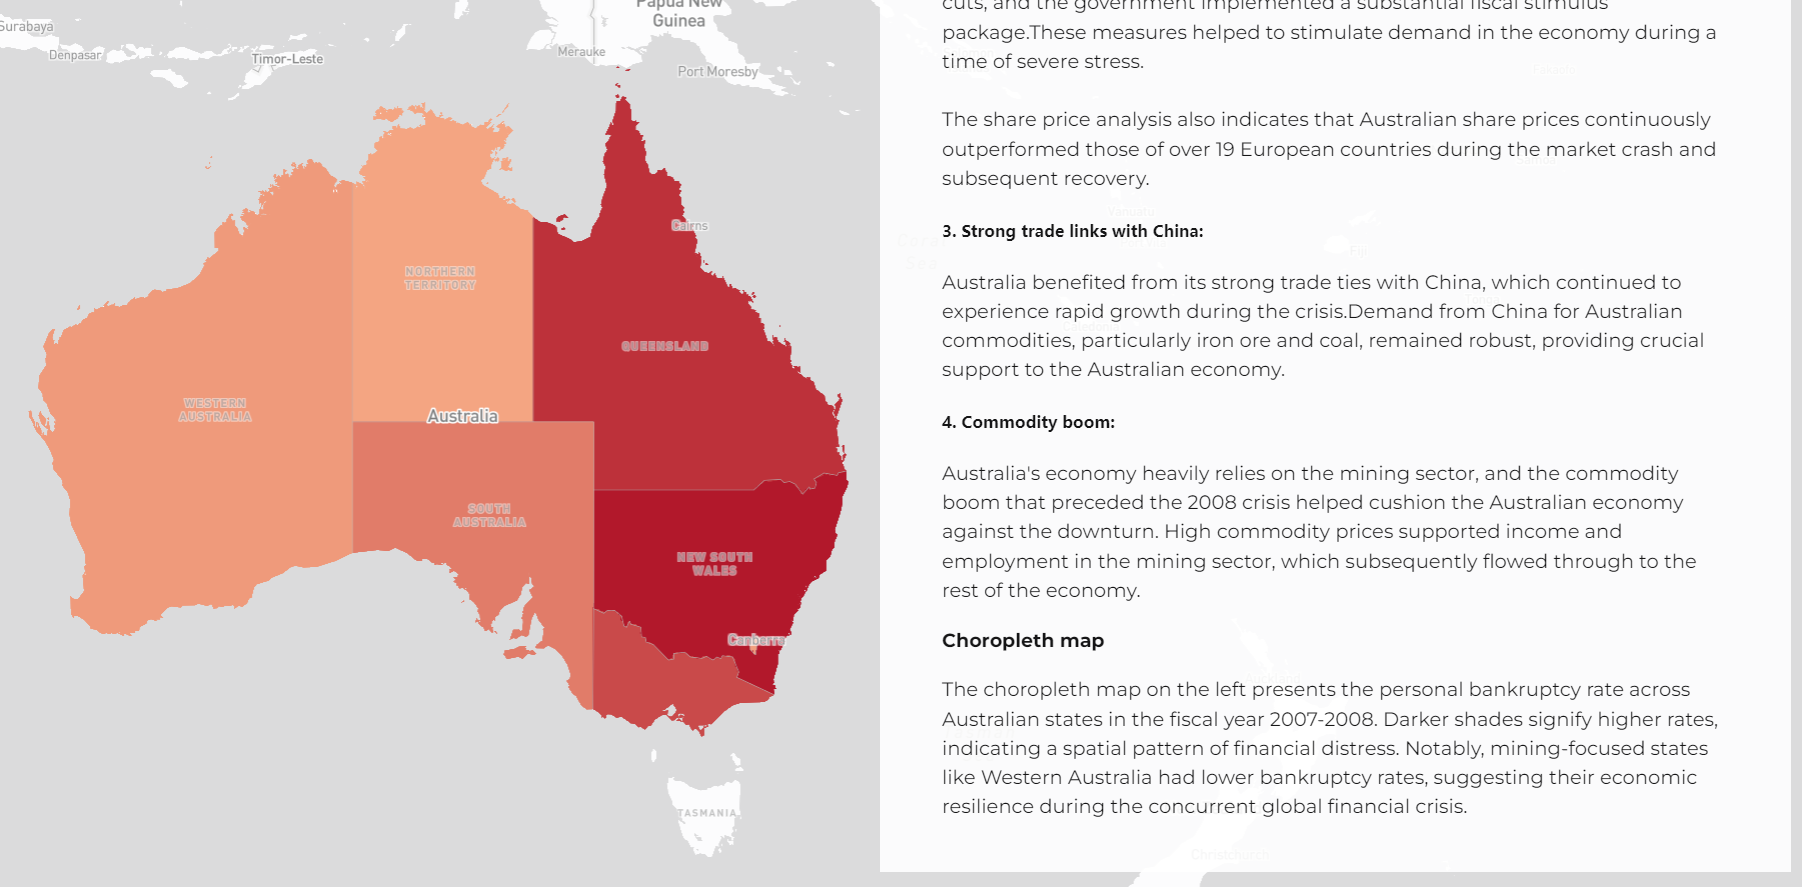
The Great Recession Visualisation
This project was part of my MSc studies at UCL, focused on Digital Visualisation. We created a website that digs into how the 2008 Great Recession affected urban growth. Our aim was to show the global, U.S., and Australia perspectives. We used various data science methods to highlight how economic downturns influence city development. The website is rich with interactive charts and maps to help you explore these complex issues easily.
The project was a group work, using Python for data analysis and HTML, CSS, and JavaScript for the web interface. What sets this project apart is the use of Scrollama for scrollytelling, making the user experience more interactive and engaging.
You can take a closer look at the project here.