5 Introduction to GEE (Google Earth Engine)
5.1 Summary
Google Earth Engine (GEE) is a cloud-based platform for analyzing and processing geospatial data. It allows users to access and process massive amounts of remote sensing data for various purposes, including land use and land cover analysis, natural resource management, and disaster response. GEE has a powerful processing infrastructure that allows users to apply various geospatial analysis techniques, such as image classification, object detection, and time-series analysis.
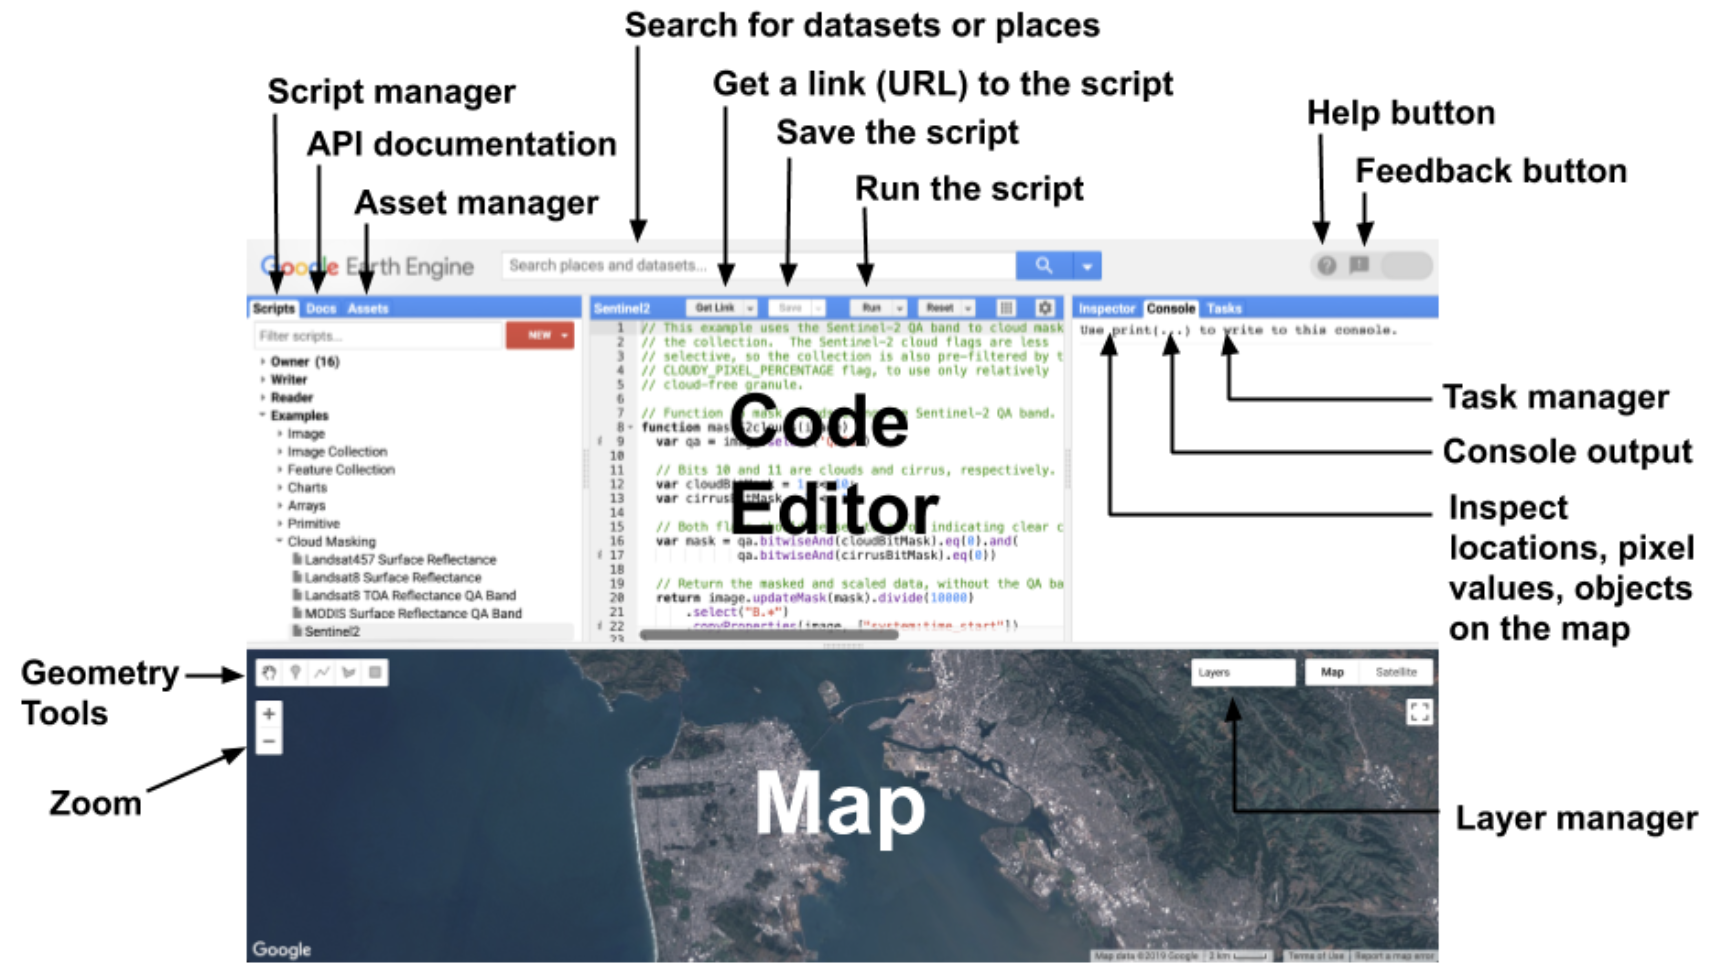
User Interface (UI) of GEE “Earth Engine Code Editor | Google Earth Engine” (n.d.):

Terms/Jargon Specific to GEE
GEE has several terms and jargon that are specific to the platform. For example, ee.Image is a class in the GEE API used to represent an image, ee.ImageCollection is used to represent a collection of images, and ee.Geometry is used to represent geometries like points, lines, and polygons. Other terms include ee.Reducer, ee.Filter, and ee.FeatureCollection. A complete list of GEE-specific terms and jargon can be found in the GEE documentation.Relating Spatial Data Formats We Have Seen to GEE
GEE can work with various spatial data formats, including GeoTIFF, NetCDF, and SHP. These formats can be uploaded to the GEE platform and processed using GEE’s tools and algorithms. GEE also supports several remote sensing data formats, including Landsat, Sentinel-2, MODIS, and more.Client vs. Server-Side
GEE processing can occur on both the client-side and server-side. The client-side involves using GEE’s JavaScript API to send requests to the server, visualize data, and process small-scale data. On the other hand, the server-side involves using GEE’s computing infrastructure to process large-scale geospatial data. The server-side can process data more efficiently and effectively than the client-side, making it ideal for large-scale analyses.Scale (Resolution)
GEE works with geospatial data at various scales or resolutions. The platform supports data with a spatial resolution ranging from a few meters to several kilometers. The choice of scale depends on the user’s analysis goals and the spatial and temporal extent of the data.Projections
GEE supports various map projections, including Geographic, UTM, and Web Mercator. The platform automatically applies the correct projection to the data, ensuring that the data is displayed correctly on the map.

GEE can be accessed through the Google Earth Engine Code Editor, where users can write and run JavaScript code to access and analyze geospatial data. Users can also use GEE’s pre-built tools, such as the Image and Feature Editors, to view and edit geospatial data directly!!
Building blocks of data (the data in GEE)
The building blocks of data in GEE are images and image collections. Images are raster data with multiple bands, such as satellite imagery, and can be processed using GEE’s built-in functions. Image collections are collections of images, and they can be filtered, sorted, and processed as a group.Collections, geometries, and features
In GEE, collections are groups of objects, such as a collection of satellite images or a collection of point locations. Geometries are shapes used to define regions of interest, such as a polygon for a city boundary. Features are objects that contain geometries and properties, such as a point location with attributes like temperature and humidity.Reducing images (e.g., zonal statistics)
Reducing images involves computing a statistic or value for each pixel or region in an image. For example, zonal statistics can be used to calculate the mean temperature for each polygon in a feature collection. GEE has built-in functions for reducing images, such as ee.Reducer.mean().Regression (over time)
Regression can be used to analyze changes in geospatial data over time. For example, linear regression can be used to analyze changes in vegetation over time using satellite imagery. GEE has built-in functions for regression, such as ee.Reducer.linearRegression().Joins
Joins involve combining data from two or more collections based on a common attribute. For example, a feature collection of cities can be joined with a table of population data based on a common attribute such as city name. GEE has built-in functions for joining data, such as ee.Join.inner().Machine learning (intro)
GEE also supports machine learning algorithms, such as classification and clustering. Machine learning can be used to classify land cover types using satellite imagery or to identify patterns in geospatial data. GEE has built-in functions for machine learning, such as ee.Classifier.svm().
In summary, GEE can be used through the Code Editor or pre-built tools to access and analyze geospatial data. The building blocks of data in GEE are images and image collections, and GEE supports collections, geometries, and features. GEE also supports reducing images, regression over time, joins, and machine learning algorithms (“JavaScript and Python Guides | Google Earth Engine | Google Developers” n.d.).
5.2 Applications
I took a look into one of the GEE applications from this Awesome Earth Engine Apps github repository, and found the study case in Indonesia!
Genangan banjir menggunakan NDWI
Which means: Flood inundation using NDWI
According to “Genangan Banjir Menggunakan NDWI” (n.d.), this GEE apps view and analyze flood inundation using the Normalized Difference Water Index (NDWI) for a specific area (East Java, Indonesia).


- The application uses NDWI, a remote sensing index that can detect water bodies’ presence and extent.
- NDWI is calculated using near-infrared and shortwave-infrared bands of satellite imagery.
- The user selects an area of interest on the map, and the application loads satellite imagery for that area.
- Then calculates the NDWI for the selected area and displays it as a map layer.
- The user can adjust the threshold value for the NDWI layer to highlight different water levels, allowing them to see areas that are potentially flooded. 6. The application also provides a time series of NDWI values, allowing the user to observe changes in water levels over time.
Clearly, this application demonstrate the potential of remote sensing for flood mapping and monitoring, which can be useful for disaster response and management (e.g. flood monitoring and early warning, water management, and environmental monitoring).
Other applications on GEE?
Many!
Including land cover and land use change detection, climate change analysis, deforestation monitoring, and crop yield estimation.
5.3 Personal Reflection
I guess GEE is a game-changer in remote sensing industry. My thought about Why it’s different?:
The GEE platform is unique because it provides access to a massive collection of geospatial datasets, tools, and algorithms in a single platform, eliminating the need for users to search and download data from multiple sources! (I remember how hard this was 10 years ago lol)
The GEE platform provides a scalable and flexible infrastructure for processing and analyzing large-scale geospatial data, enabling users to conduct complex analyses quickly and efficiently.
The platform is also accessible to anyone (with an internet connection, of course!), making it an excellent tool for democratizing geospatial analysis.